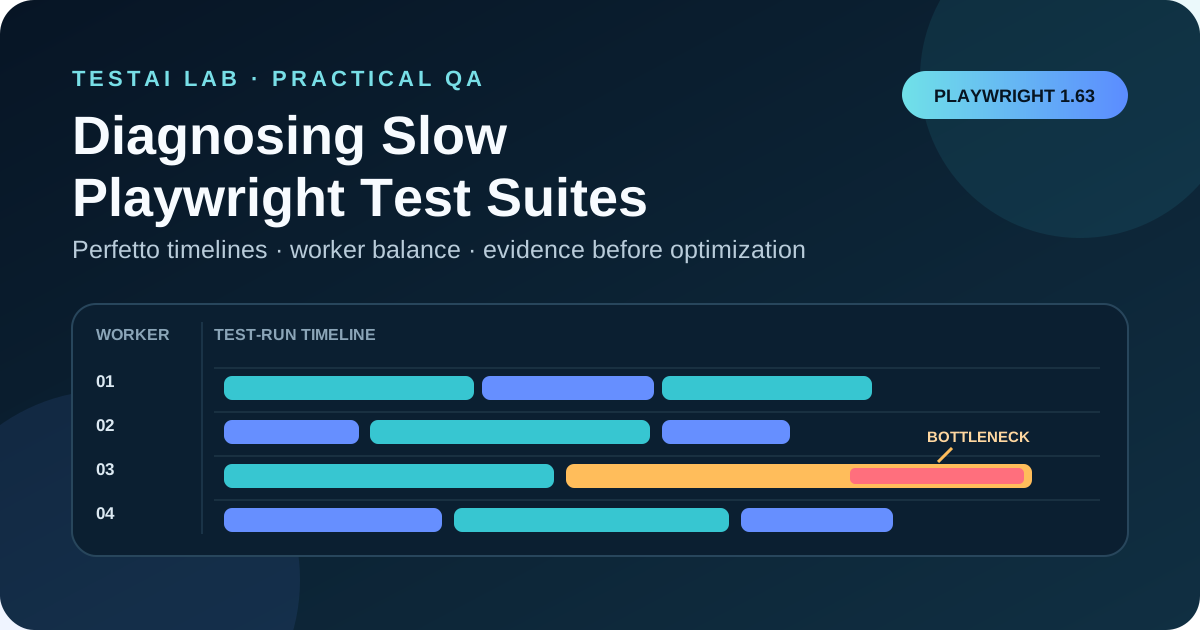
Playwright 1.63 added two useful views for performance-oriented test-suite analysis: a built-in Perfetto reporter and a duration waterfall in the HTML report. They do not diagnose root causes automatically, but they make scheduling and timing evidence easier to inspect.
This guide shows how to capture a baseline, read worker lanes and nested test activity, form a hypothesis, and verify whether a change actually improves the suite.
What the Perfetto reporter records
The reporter writes a file in the Trace Event Format used by Perfetto UI and chrome://tracing. Playwright renders the run as a timeline with one lane per worker.
Each test is represented as a slice. Its hooks, fixtures, and test.step() steps appear as nested slices. Trace-event arguments can include:
- source locations;
- step parameters;
- tags and annotations;
- errors;
- standard output and standard error;
- paths to attachment files.
This is test-run instrumentation, not browser performance telemetry. It does not replace Core Web Vitals measurement, a browser performance profile, backend observability, or infrastructure monitoring.
Enable the reporter
The smallest command is:
npx playwright test --reporter=perfettoBy default, Playwright writes the report to:
test-results/perfetto.jsonFor large suites, a gzip-compressed output is usually more practical. Both Perfetto UI and chrome://tracing accept it:
// playwright.config.ts
import { defineConfig } from '@playwright/test';

export default defineConfig({
  reporter: [
    ['list'],
    ['html', { open: 'never' }],
    ['perfetto', { outputFile: 'test-results/perfetto.json.gz' }],
  ],
});
You can also configure the output through PLAYWRIGHT_PERFETTO_OUTPUT_DIR, PLAYWRIGHT_PERFETTO_OUTPUT_NAME, or PLAYWRIGHT_PERFETTO_OUTPUT_FILE.
One important command-line detail: --reporter replaces the configured reporters. If you need to keep the existing reporters and append Perfetto, Playwright 1.63 also provides --add-reporter:
npx playwright test --add-reporter=perfettoBuild a trustworthy baseline
A single run can be misleading. Shared CI capacity, cold caches, external services, retries, and test data may all change the result.
Use a controlled baseline:
- Pin the Playwright version, browser project, worker count, test selection, and CI runner type.
- Run the same suite several times under comparable conditions.
- Save the Perfetto report, HTML report, total wall-clock time, and run metadata.
- Record retries, failures, external-service incidents, and unusual runner load.
- Compare distributions or repeated observations, not only one fastest run.
Give the artifacts unambiguous names in CI, for example:
perfetto-before-2026-10-27.json.gz
perfetto-after-2026-10-27.json.gz
Do not commit large reports to the source repository by default. A protected CI artifact store with a short retention period is usually safer and easier to manage.
Read the Perfetto timeline
Open ui.perfetto.dev, choose Open trace file, and select the JSON or JSON.GZ report. For sensitive projects, follow your organisation's policy before loading an artifact into any tool.
1. Start with worker lanes
Look at how work is distributed:
- Are several lanes busy at the same time?
- Does one worker continue long after the others finish?
- Are there large idle gaps?
- Do tests that must run serially create a visible queue?
A long lane does not prove that the worker itself is defective. It tells you where to investigate test distribution, serial groups, locks, dependencies, and uneven file sizes.
2. Inspect long test slices
Zoom into the longest tests and examine their nested slices. Playwright documents nested hooks, fixtures, and steps in the timeline. Ask:
- Is setup or teardown consuming most of the test?
- Is a worker-scoped fixture expensive once, or is a test-scoped fixture repeated?
- Is a named
test.step()consistently slow? - Does an error or retry explain the longer execution window?
Names and source locations are evidence for navigation. They are not proof of causation.
3. Use trace-event arguments
The details attached to a slice can point to its source line and include tags, annotations, errors, output, step parameters, and attachment paths. Use them to connect a timeline observation with the relevant code and run evidence.
Avoid putting secrets or personal data into test titles, annotations, step parameters, logs, or attachment filenames. Those values may become part of the report.
4. Use the HTML duration waterfall as a second view
Playwright 1.63 also adds a duration waterfall next to test steps in the HTML report. It is useful for quickly seeing which steps dominate a particular test.
Treat the HTML waterfall and Perfetto timeline as complementary reports from the same run. The official documentation does not describe automatic cross-navigation between them, so compare them manually by test and step name.
Separate three classes of delay
A useful investigation distinguishes where the time is spent.
Application or service latency
Possible signals:
- a step waits for a UI state or API response;
- the same action is slow outside the test runner;
- backend or network evidence shows matching latency.
Possible next checks include server timing, request duration, dependency health, and a controlled mock comparison.
Test-design overhead
Possible signals:
- repeated authentication or data creation in a test-scoped fixture;
- expensive setup or teardown around every test;
- polling loops with overly broad intervals or timeouts;
- duplicated preparation hidden inside helpers.
Optimise only after confirming isolation and data-safety requirements. Moving setup to beforeAll or sharing state can make tests faster but also create coupling and order dependence.
Scheduling or worker imbalance
Possible signals:
- one worker lane stays busy while others are idle;
- a large test file cannot be distributed efficiently;
- serial configuration, locks, or dependencies intentionally restrict concurrency.
Increasing workers is not an automatic fix. It may increase contention, rate-limit failures, resource use, or flakiness.
A safe before-and-after workflow
Use this loop for every proposed optimisation:
- Observe — identify a repeated timeline pattern, not an isolated spike.
- Form one hypothesis — for example, “authentication setup is repeated per test.”
- Change one variable — keep browser, worker count, runner, and test selection stable.
- Repeat the measurements — collect several comparable after-runs.
- Check quality, not only speed — verify pass rate, retries, isolation, logs, and cleanup.
- Keep or revert — accept the change only when the evidence is repeatable and no quality regression appears.
A shorter slice and lower total time support the hypothesis. They still do not prove that the change will help every environment or every suite.
Example investigation
Suppose one worker lane repeatedly finishes much later than the others.
The timeline shows that a large file contains several long tests. Their nested fixtures are not unusually expensive, and the application steps have similar duration across runs.
A reasonable experiment is to split that file into smaller independent files or enable parallel execution for a safe group. Then repeat the same suite with the same worker count.
The change is successful only if:
- wall-clock time improves across repeated runs;
- pass and retry rates do not regress;
- tests remain isolated;
- shared accounts, data, and external services are not overloaded.
If the improvement disappears on a busier CI runner, the original observation may have been confounded by infrastructure load.
Security and operational cautions
Perfetto reports can contain operationally sensitive evidence such as test names, source locations, step parameters, errors, standard output, and attachment paths.
Apply these controls:
- restrict artifact access;
- keep retention as short as the investigation permits;
- do not expose reports in public build artifacts;
- redact secrets and personal data at their logging source;
- review attachment names and contents separately;
- use compressed output for large runs;
- document the Playwright version used to generate each baseline.
An attachment path in the report is not the attachment itself, but the referenced screenshot, log, video, or other file may contain additional sensitive data.
QA checklist
Before accepting a test-suite optimisation, confirm:
- [ ] Playwright version, browser project, workers, and runner type are recorded.
- [ ] The baseline uses repeated comparable runs.
- [ ] Perfetto and HTML artifacts come from the same run set.
- [ ] The observation is linked to a specific worker, test, hook, fixture, or step.
- [ ] The explanation is labelled as a hypothesis until verified.
- [ ] Only one meaningful variable changes during the experiment.
- [ ] Pass rate, retries, flakiness, isolation, and cleanup are checked.
- [ ] Shared systems are not overloaded by higher concurrency.
- [ ] Trace artifacts do not expose secrets or personal data.
- [ ] The result is repeatable and documented.
Conclusion
The Perfetto reporter gives Playwright teams a timeline of the test runner itself: worker lanes, test slices, and nested hooks, fixtures, and steps. The HTML duration waterfall adds a convenient step-level view.
The most valuable practice is not simply producing a trace. It is using controlled before-and-after measurements, separating application latency from test overhead and scheduling, and preserving correctness while optimising execution time.
Sources
- Playwright release notes, version 1.63: Playwright 1.63 release notes
- Playwright reporters, Perfetto reporter: Playwright Perfetto reporter documentation
Leave a comment
Share your thoughts about the article. No account is required.
Comments
Loading comments…