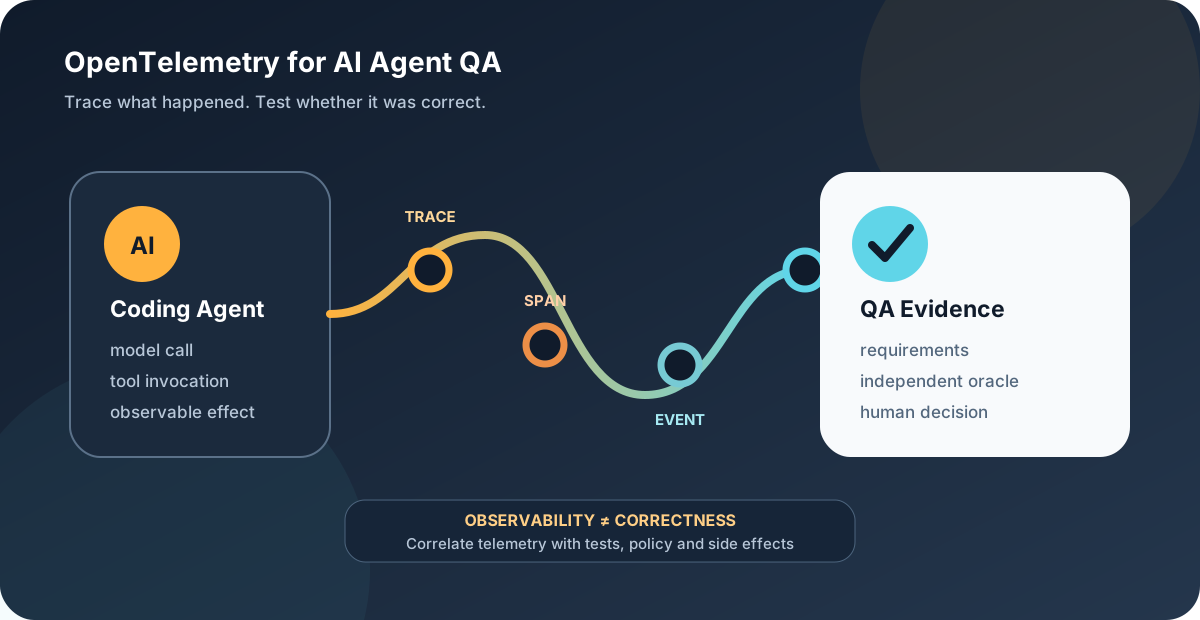
Practical guidance for turning GitHub Copilot’s OpenTelemetry streams into independent test artefacts
1. Why Observability Matters for AI‑Assisted Development
AI coding assistants such as the GitHub Copilot app are no longer a single “black‑box” completion service. In an enterprise setting the agent can invoke a language model, call external tools (e.g., a linter, a test runner, a secret‑scanner), and decide whether to apply a suggestion automatically or present it to a developer. Each of those steps generates telemetry that can be exported through OpenTelemetry (OTel) – the open standard for distributed tracing, metrics and events.
For QA teams, telemetry is a source of evidence that complements traditional test artefacts (test cases, logs, screenshots). It lets us answer questions such as:
- Did the agent request the expected model version for a given workflow?
- Were tool calls authorised according to the organization’s policy?
- Did a session finish with a “rejected” status after a security‑related tool failure?
The key is to treat the data as observability, not as proof of correctness. A trace shows what happened, not whether the outcome satisfies the product’s requirements.
2. Core OTel Concepts in an Agent Session
| Concept | What it looks like in a Copilot trace | Typical QA relevance |
|---|---|---|
| Trace | A unique identifier that groups all work performed to satisfy one user request (e.g., “Generate a function to validate a JWT”). | Provides the scope for evidence collection – every span inside belongs to the same logical test case. |
| Span | A timed operation with a name, start/end timestamps, attributes, and optional status. In Copilot you will see spans such as model.request, tool.invoke:eslint, agent.decide. | Allows you to assert that a particular step occurred (e.g., a linting tool was called) and to measure its latency. |
| Metric | Numeric values emitted periodically or on events (e.g., copilot.tokens_used, copilot.session_duration). | Useful for trend analysis – rising token consumption may indicate a regression in prompt efficiency. |
| Event | Timestamped annotations attached to a span (e.g., error:tool.timeout, log:policy‑violation). | Gives context for failures that are not reflected in the span status alone. |
GitHub’s documentation confirms that model calls, tool invocations and the overall session flow are captured as spans, while prompts, completions and tool arguments are omitted by default. Optional “content capture” can be enabled, but it introduces privacy considerations (see § 5).
3. Mapping Telemetry to Test Evidence
The first step is to decide which telemetry fields become test evidence and how they relate to the product’s requirements, permissions and observable side‑effects. The following matrix illustrates a practical mapping for a typical “code‑generation” workflow.
| Requirement (example) | Telemetry source | Evidence artefact | Validation rule |
|---|---|---|---|
The agent must use the organization‑approved model gpt‑4‑enterprise. | Span attribute model.id on model.request | Trace snapshot (JSON) | model.id == "gpt-4-enterprise" |
Only the eslint tool may be invoked for JavaScript files. | Span name tool.invoke + attribute tool.name | Span list | tool.name ∈ {"eslint"} |
| All tool calls must be authorised by the policy service. | Event policy.violation (if any) on any span | Event log | No policy.violation events present |
A session that modifies a file must emit a file.write event with the correct path. | Event file.write on agent.decide span | Event record | event.path == expectedPath |
Failure to resolve a secret must abort the session with status error. | Span status error on tool.invoke:secret‑scanner | Trace status | status == "error" |
Each row can be turned into an assertion that a tester runs against the exported trace data (e.g., using a simple script that queries the OTel collector). The assertion does not guarantee the generated code is correct; it only confirms that the agent behaved according to the observable contract.
4. Example Trace Assertions
Below are three concrete assertions a QA engineer might codify in a test harness. The pseudo‑code assumes the trace data is stored in an OTLP‑compatible backend that can be queried with the OpenTelemetry Protocol (OTLP) or a SQL‑like interface.
Model version enforcement
SELECT DISTINCT attributes["model.id"]
FROM spans
WHERE trace_id = $TRACE_ID
  AND name = 'model.request';
Pass condition: the result set contains exactly one row and the value equals gpt-4-enterprise.
Tool permission check
SELECT name, attributes["tool.name"]
FROM spans
WHERE trace_id = $TRACE_ID
  AND name = 'tool.invoke';
Pass condition: every tool.name is in the whitelist {eslint, unit-test-runner}.
Negative security scenario – secret exposure
SELECT status, events
FROM spans
WHERE trace_id = $TRACE_ID
  AND name = 'tool.invoke:secret-scanner';
Pass condition: status = "error" and an event error:secret-leak is present.
These assertions are read‑only checks; they do not modify the system under test. They can be executed automatically after a CI run that enables telemetry, but the final verdict (e.g., “the agent is safe for production”) must still involve a human review.
5. Privacy‑Safe Defaults and Content Capture
GitHub’s official Copilot telemetry policy states that prompt text, model responses and tool arguments are excluded by default. Enabling the optional “content capture” flag adds those fields to the exported spans.
| Risk | Mitigation |
|---|---|
| Sensitive code or proprietary prompts become visible in the collector. | Keep content capture off in production. Enable it only in a controlled pilot with strict access controls and audit logging. |
| Accidental retention of raw prompts in long‑term storage. | Configure the collector’s retention policy to purge spans containing content after a short window (e.g., 7 days). |
| Sampling may drop rare error paths. | Use a sampling rate of 100 % for security‑critical workflows, and a lower rate (e.g., 10 %) for routine code‑completion sessions. |
| Unauthorized users querying traces that contain code snippets. | Restrict query permissions to the QA and security teams; log every access to the telemetry store. |
These controls align with the guidance in the GitHub Docs that “content capture is the hard boundary” and should be treated as a separate data‑loss channel.
6. Sampling, Retention and Measurable Quality Indicators
| Indicator | How to derive from telemetry | Target range (example) |
|---|---|---|
| Average session latency | Metric copilot.session_duration (mean) | ≤ 2 s for simple completions |
| Tool‑failure rate | Count of spans with status = error on tool.invoke:* divided by total tool spans | ≤ 1 % |
| Policy‑violation events | Event policy.violation count per 1 k traces | 0 |
| Token‑efficiency | Metric copilot.tokens_used per successful session | ≤ 150 tokens for a 30‑line function |
| Trace completeness | Percentage of sessions where all expected spans (model, tool, decision) are present | ≥ 95 % |
Collecting these indicators over time lets the team spot regressions before they surface in production bugs.
7. Risk‑Based Triage Workflow
- Ingest – Telemetry is streamed to the organization’s OTLP collector (e.g., Splunk, Jaeger, OpenTelemetry Collector).
- Classify – Automated rules evaluate each trace against the assertion matrix. Traces that fail any rule are flagged as high‑risk; those that pass are low‑risk.
- Enrich – For high‑risk traces, pull in auxiliary artefacts (Git diff, CI logs, security scan reports) to provide context.
- Review – A QA analyst examines the flagged traces, validates the failure, and decides whether it is a true defect, a false positive, or a policy‑violation that requires remediation.
- Act –
Defect – Create a bug ticket, attach the trace as evidence. Policy breach – Escalate to security, adjust the managed‑settings.json to tighten permissions. * False positive – Refine the assertion rule or adjust sampling.
- Close – Record the decision in a trace‑audit log; the log itself becomes part of the compliance evidence.
Human judgment is the final arbiter at step 4; automation only surfaces candidates.
8. Five Questions Every Tester Should Ask When Evaluating an AI Agent
- Which model version is the agent using for this workflow, and does it match the approved baseline?
- Are all tool invocations recorded in the trace, and do they respect the organization’s permission matrix?
- What observable side‑effects (file writes, network calls, secret accesses) are emitted as events, and are they expected?
- If a failure occurs, does the trace contain a clear error status and supporting event details, or is the failure silent?
- How is sensitive content handled – is content capture disabled, and are retention and access controls enforced?
Answering these questions with concrete trace evidence builds a defensible test case that survives audits.
9. Where Automation Helps
- Bulk assertion execution – Running the matrix of SQL‑style checks against thousands of traces is trivially automated, freeing testers to focus on the interpretation of failures.
- Anomaly detection – Machine‑learning models can flag spikes in latency or token usage that exceed historical baselines, prompting a deeper manual review.
- Policy‑violation alerts – Real‑time event pipelines can push a Slack notification when a
policy.violationevent appears, ensuring rapid response.
Automation is valuable for data collection, pattern detection and alerting, but it never replaces the need for a human to decide whether a deviation constitutes a defect, a security issue, or an acceptable variance.
10. Conclusion
OpenTelemetry gives QA teams a transparent view into the inner workings of AI coding agents such as GitHub Copilot. By extracting traces, spans, metrics and events, we can construct a test‑evidence matrix that links observable behaviour to requirements, permissions and side‑effects. The approach respects privacy by keeping content capture off by default, applies risk‑based sampling and retention, and embeds human judgment at the critical triage point.
In practice, the combination of automated assertions and manual exploratory analysis yields a robust evidence trail that supports compliance, security reviews and continuous improvement of AI‑assisted development pipelines.
Sources
- GitHub Changelog – OpenTelemetry in the GitHub Copilot app (2026‑09‑22) – https://github.blog/changelog/2026-09-22-opentelemetry-in-the-github-copilot-app/
- GitHub Docs – OpenTelemetry for Copilot – https://docs.github.com/en/copilot/concepts/enterprise/opentelemetry
- OpenTelemetry — Observability Primer — https://opentelemetry.io/docs/concepts/observability-primer/
- OpenTelemetry — Tracing API — https://opentelemetry.io/docs/specs/otel/trace/api/
Leave a comment
Share your thoughts about the article. No account is required.
Comments
Loading comments…